
Making it easier to choose what to do – PICK charts
By Olga Murdoch, Agile Lead.
What is a PICK chart used for?
A previous post was about using affinity brainstorming to get ideas from a group of people. A PICK chart is used to organise that information in a meaningful way so it is easier to act on.
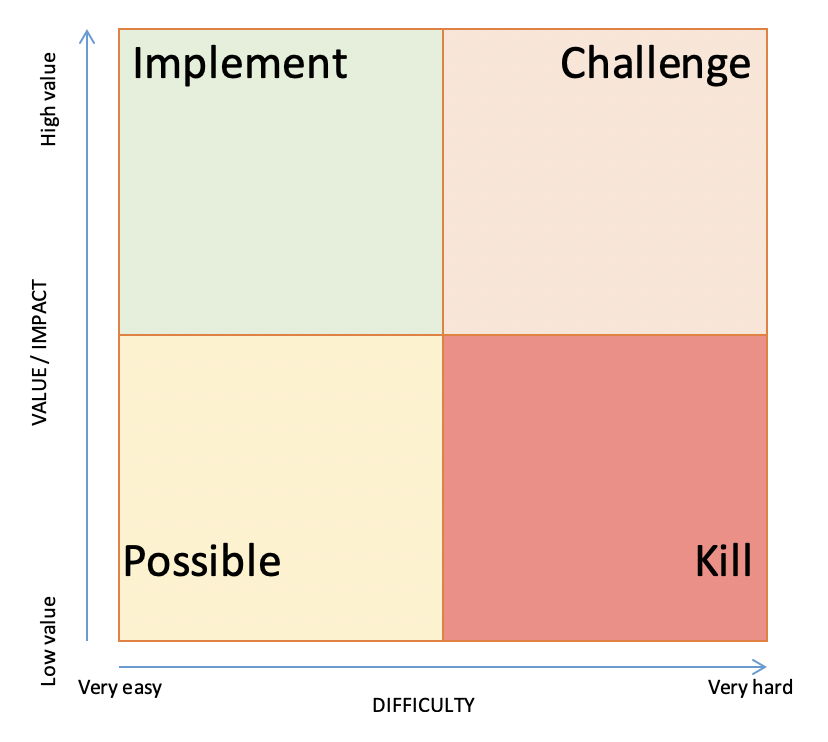
PICK stands for ‘possible’, ‘implement’, ‘challenge’, ‘kill’ and this specific tool is generally used when choosing a problem to tackle or solution to implement. You can take the general idea and customise it to make group inputs more meaningful for other use cases too.
Why should someone use it?
The PICK chart makes it really easy to see which ideas you should run with, and which ideas you might want to run away from (or at least think about in more detail!).
By plotting ideas against how impactful they are, versus how difficult they may be, the PICK chart makes it clear which ideas should be considered (possible), which we should just do now (implement), which we expect to be difficult but potentially worth it (challenge), and which are not worth the effort required (kill).
Having this information at our fingertips makes it easier for a group to agree on actions to take place as a consequence.
Directions on how to use it
Step 1: Generate the ideas
Using affinity brainstorming, or another means, generate ideas from your team. Each idea should be written one per post-it and in clear handwriting.
Step 2: Draw the chart
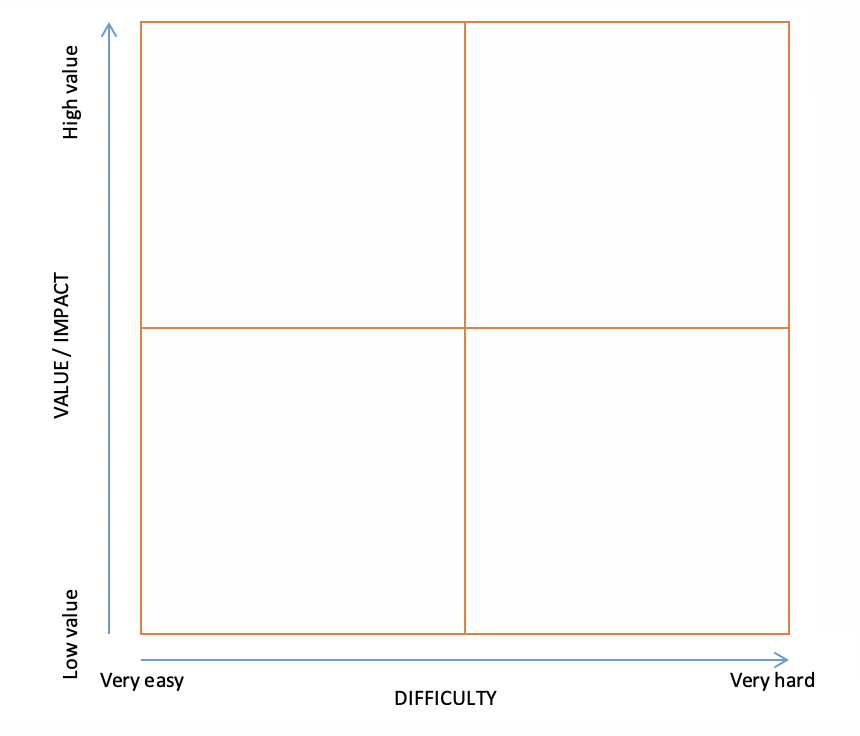
Depending on your setup, you might have the chart printed or drawn on large sheets of paper which you can stick on the wall. If you have whiteboards available, simply draw the chart on the wall as shown in this example. On the vertical line, write ‘value/impact’ (low to high) and on the horizontal line write difficulty (very easy to difficult).
Step 3: Ask the team to place their post-its in the appropriate place in the chart
Each member of the group will consider each of their ideas with respect to its potential value and the effort it will require. Depending on the volume of ideas, you might choose to have each person do this independently or to have a conversation with the group as each new idea is placed.
Step 4: Discuss the placement
Once all the ideas are placed, the discussion can turn to ‘what next?’. The PICK chart provides you with more information depending on which quadrant the post-its have ended up in. At this point, the group might decide to go ahead and implement everything in the ‘high-value and easy’ quadrant and evaluate what options there are with respect to the ‘high-value and difficult’ quadrant.
What now?
Why not try out this tool yourself, and let me (olga.murdoch@ucd.ie) know how you get on.
Contact agile@ucd.ie for support on using tools such as this and others.